Why does climate sensitivity increase over time in models? A look at two possibilities
Note: if the terms used in this article seem confusing, check out the previous one.
Introduction
It’s well known that climate models show increasing sensitivity over time: for a given forcing, the true long-term temperature increase (ECS) is higher than what you’d estimate if you simply extrapolated from the past (ECS_hist). In other words, the ECS-to-ECS_hist ratio is above 1. This article tries to work out why climate models behave like that; that is to say, the variable I’m trying to explain is the ECS-to-ECS_hist ratio.
Now, there’s probably too many hyphens and underscores in the text. So it will be more readable if I clarify that, every time I talk simply about ‘correlation’, I mean the correlation of thing X with the ECS-to-ECS_hist ratio. If other kind of correlation is mentioned, I’ll say so explicitly.
Possible reasons the ECS-to-ECS_hist ratio is above 1
The recent Lewis & Curry paper on sensitivity (from this point on LC18) mentioned that the difference between ECS and ECS_hist is related to ECS_hist itself: the higher it is, the higher the ratio between ECS and ECS_hist. What I reported in the previous article is that while this association is true, it’s also very weak; a much stronger explanation for the ECS-to-ECS_hist ratio is the difference between ECS_hist and TCR. In the previous article I explained why, physically, this second association makes sense: any difference between ECS and ECS_hist has to be driven by forcing that has gone into the ocean, i.e. that which hasn’t warmed the atmosphere yet. The ECS_hist-to-TCR ratio is simply another way of expressing how much forcing has gone into the ocean, versus how much has warmed the atmosphere.
If ocean heat uptake is a big share of the forcing experienced so far, then the simple sensitivity formula used in the energy budget papers involves a lot of extrapolation, meaning ECS_hist will be a less reliable measure (the true sensitivity value, ECS, may turn out to be very different from ECS_hist). By contrast, if ocean heat uptake is small as a proportion of forcing, there is not much room for ECS to deviate from ECS_hist.
The association between ECS_hist and the ECS-to-ECS_hist ratio was point was a minor one in LC18; mostly the authors were responding to a previous study by Kyle Amour (hereinafter A17). After checking out A17, I noticed it made the argument much more strongly. I thought this was strange, as going by the LC18 data the relationship didn’t seem worth writing much about, so I decided to work with A17’s numbers as well.
Just to be clear, my objective is not to discuss whether the values in one paper are more correct than those of the other. Rather, what I want to see is if the conclusions I drew apply to both papers.
Differences between LC18 and A17
A17 provides data from 21 climate models. It offers one measure of ECS_hist (called ECS_infer in the paper) as well as one of ECS.
LC18 uses data from 31 climate models, including all those featured in A17. It reports three measures of ECS_hist, one of which is meant to be equivalent to the measure featured in A17. It also includes TCR and ECS values.
Because A17 doesn’t provide TCR figures, in order to calculate the ECS_hist-to-TCR ratio for that study I take them from LC18. The discussion in the latter paper indicates that there is close agreement among different sources on the models’ TCR values, so I don’t think this will bias the analysis.
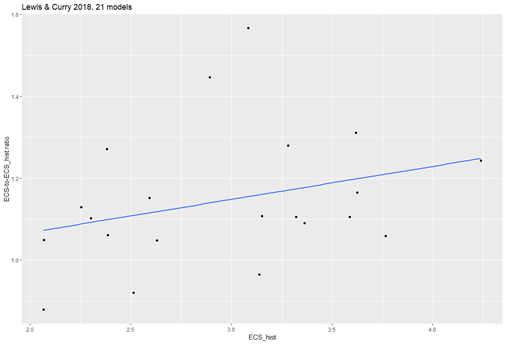
Here we go. If you take all models in LC18 and plot the ECS-to-ECS_hist ratio vs ECS_hist, well, yes, there’s an association. But not much: the correlation (r) is only 0.135.

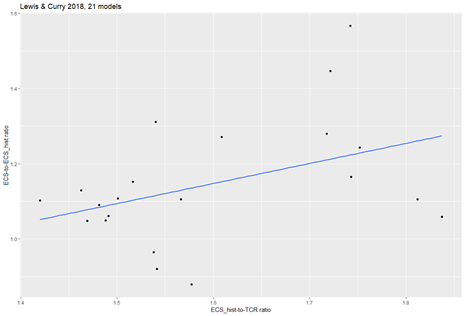
If by contrast you plotted the ECS-to-ECS_hist ratio against the ECS_hist-to-TCR ratio, you see something more. It’s a correlation of about 0.42, meaning the ECS_hist-to-TCR ratio explains 17.5% of the variance.

I wondered why A17 hadn’t reported this. It turns out, if you run the numbers on A17’s data, the opposite is true: there is no relationship between the ECS_hist-to-TCR ratio and the ECS-to-ECS_hist ratio.

But if you chart ECS_hist itself versus the ECS-to-ECS_hist ratio, there is a relationship — and it’s stronger than in LC18, though still not very (r = 0.21, p-value = 0.36).

In the above LC18 charts I used all of the paper’s models, as well as its main ECS_hist estimate (which is an average of three measures the study uses). I wondered if the different results were due simply to the use of a different method of estimating ECS_hist, or the addition of models, so I decided to compare the studies again.
Comparing apples to apples: 21 models in both studies, equivalent measure of ECS_hist
In these charts I take only the LC18 models that are also included in A17. I also take the ECS_hist measure that corresponds to A17’s measure, called ICS.1pct. Likewise, instead of taking the ECS-to-ECS_hist ratio that LC18 reports, I calculated a new one that uses only the ICS.1pct measure. In short, the comparison is as apples-to-apples as it gets.
Before we get to the charts, let’s recap:
· I use the same TCR values in both papers.
· ECS_hist values in both studies are very similar: correlation between them is 0.97.
· ECS values are even more similar: their correlation is 0.996!
A17 offers figures rounded to one decimal whereas LC18 gives the raw data. I tested this: the correlation between A17 values and pseudo-LC18 data (rounded to one decimal number) is almost the same as with the actual LC18 data. So rounding is not an issue.
With differences this small, you’d expect both papers to give essentially the same answer. Indeed, at first sight this comparison does seem to partly ‘reconcile’ the papers. In LC18, ECS_hist now has a correlation of 0.3 (p-value = 0.18).
The explanatory power of the ECS_hist-to-TCR ratio is basically the same it was when using all models (r = 0.42), though with less data it’s less statistically significant (p-value = 0.06).
One could say that, when restricting LC18 to the setup used in A17, the ECS_hist-to-TCR ratio still hast the most explanatory power, but ECS_hist by itself cannot be dismissed. Whereas in A17 there is only one explanatory variable, ECS_hist, with the ECS_hist-to-TCR ratio playing no role at all.
However, even this partial ‘reconciliation’ is not real.
Regressing against both variables
Here’s a problem: ECS_hist and the ECS_hist-to-TCR ratio are themselves correlated, and highly so (approximately, r ranges from 0.5 to 0.7). A model with a high ECS-hist-to-TCR ratio will have a high ECS_hist, and viceversa.
Obviously, if A is correlated with B and B is in turn correlated with C, probably you’ll see a correlation between A and C. But that doesn’t mean the association between A and C is real. Maybe the correlation of A and C comes about entirely from A’s relationship with B. Perhaps, holding B constant, an increase in A is not associated with an increase in C.
Multiple regression is a way to figure that out. In A17, when regressing against both ECS_hist and ECS_hist-to-TCR ratio, as you’d expect the latter plays no role (it actually has a negative regression coefficient). But what happens with LC18 is more interesting: the apparent correlation that ECS_hist had (0.3) turns out to be spurious. The regression coefficient of ECS_hist is effectively zero.
So it seems we’re back to square one. In LC18, the ECS-to-ECS_hist ratio is explained to a small degree by the ECS_hist-to-TCR ratio; ECS_hist itself plays virtually no role. In A17 it’s the opposite: ECS_hist provides some explanatory power, while the ECS_hist-to-TCR ratio has no explanatory power at all.
What’s up with the outlier dot at the top of all these charts?
The dot with the highest ECS-to-ECS_hist ratio is the CSIRO model. I ran all the numbers without it, though I will not include the charts because the post already has enough of those.
In terms of correlation, excluding CSIRO does seem to change things quite a bit: for LC18, the two measures essentially converge and now have the same correlation (0.34). p-value is about 0.14 for both.
In the case of A17, both correlations increase (ECS_hist remains much higher than the ECS_hist-to-TCR ratio, 0.39 vs 0.15). So, the story could be that in A17 it’s ECS_hist that has explanatory power, with ECS-to-ECS_hist ratio playing a very small role, whereas in LC18 both measures explain part of the ECS-to-ECS_hist ratio
But when doing multiple regression the image becomes less clear. The ECS_hist-to-TCR ratio again has no explanatory power in A17. And in LC18, both measures retain a positive regression coefficient but they are even less statistically significant than before.
This makes sense: in LC18, the correlation that each variable had with the ECS-to-ECS_hist ratio (0.34) in fact was partly contributed by the other measure. So both ECS_hist and the ECS_hist-to-TCR ratio have some explanatory power, but much less than what you’d believe if you looked at one of them independently of the other.
If you’re wondering what happens when you run the regression using all 31 models from LC18, the picture gets clearer: ECS_hist has no explanatory power (actually a negative coefficient), whereas the ECS_hist-to-TCR ratio has a positive and statistically significant relationship with the variable we want to explain. The weak correlation that ECS_hist showed, discussed at the beginning of the article (0.135), turns out to be spurious. The result is similar if one excludes CSIRO from the list of 31 models, though in that case the ECS_hist-to-TCR ratio falls a bit short of statistical significance (p-value = 0.08).
Conclusions
The data from A17 and LC18 are extremely similar but lead to different interpretations even when using the same climate models, same TCR values, and an equivalent measure of ECS_hist. In A17, the ECS-to-ECS_hist ratio is explained weakly by ECS_hist, and not at all by the ECS_hist-to-TCR ratio; the result remains the same if you exclude the CSIRO outlier. In LC18, it’s the ECS_hist-to-TCR ratio and not ECS_hist that provides explanatory power. But if you exclude CSIRO then both measures have about the same explanatory power (which is to say almost none).
With the additional data available in LC18 (i.e. all 31 models), it’s clear that the ECS_hist-to-TCR ratio is a better explanatory variable. Even so, it explains less than 20% of the variance in the ECS-to-ECS_hist ratio. Clearly, there are other reasons why climate models show increased sensitivity over time.
Data and code
The code used for this article can be found here. The A17 data is added manually in R, so the only other thing you need is the ECStoICS.csv file from LC18.
